

By Samantha Smith at BWCI
samantha.smith@bwcigroup.com
“data in the COVID-19
pandemic years is problematic”
Actuaries use mortality tables daily to estimate how much to reserve for a liability that is contingent on a human life. In a pension scheme context, these liabilities include the benefits payable on death in service and retirement pensions. The data from which these tables are derived is analysed by the Institute and Faculty of Actuaries’ Continuous Mortality Investigation (CMI).
Anatomy of a mortality table
There are two elements to pension scheme mortality tables: the base table and the “improvement” factors.
You can think of base tables as what rates of mortality are like “now”. Improvement factors are an estimate of how these rates are projected to change in the future. The terminology is unfortunate, since it suggests that mortality rates will always improve; in recent years this has not been the case and “improvements” have been negative. Factors such as medical advances and social changes are expected to have an impact on future mortality trends.
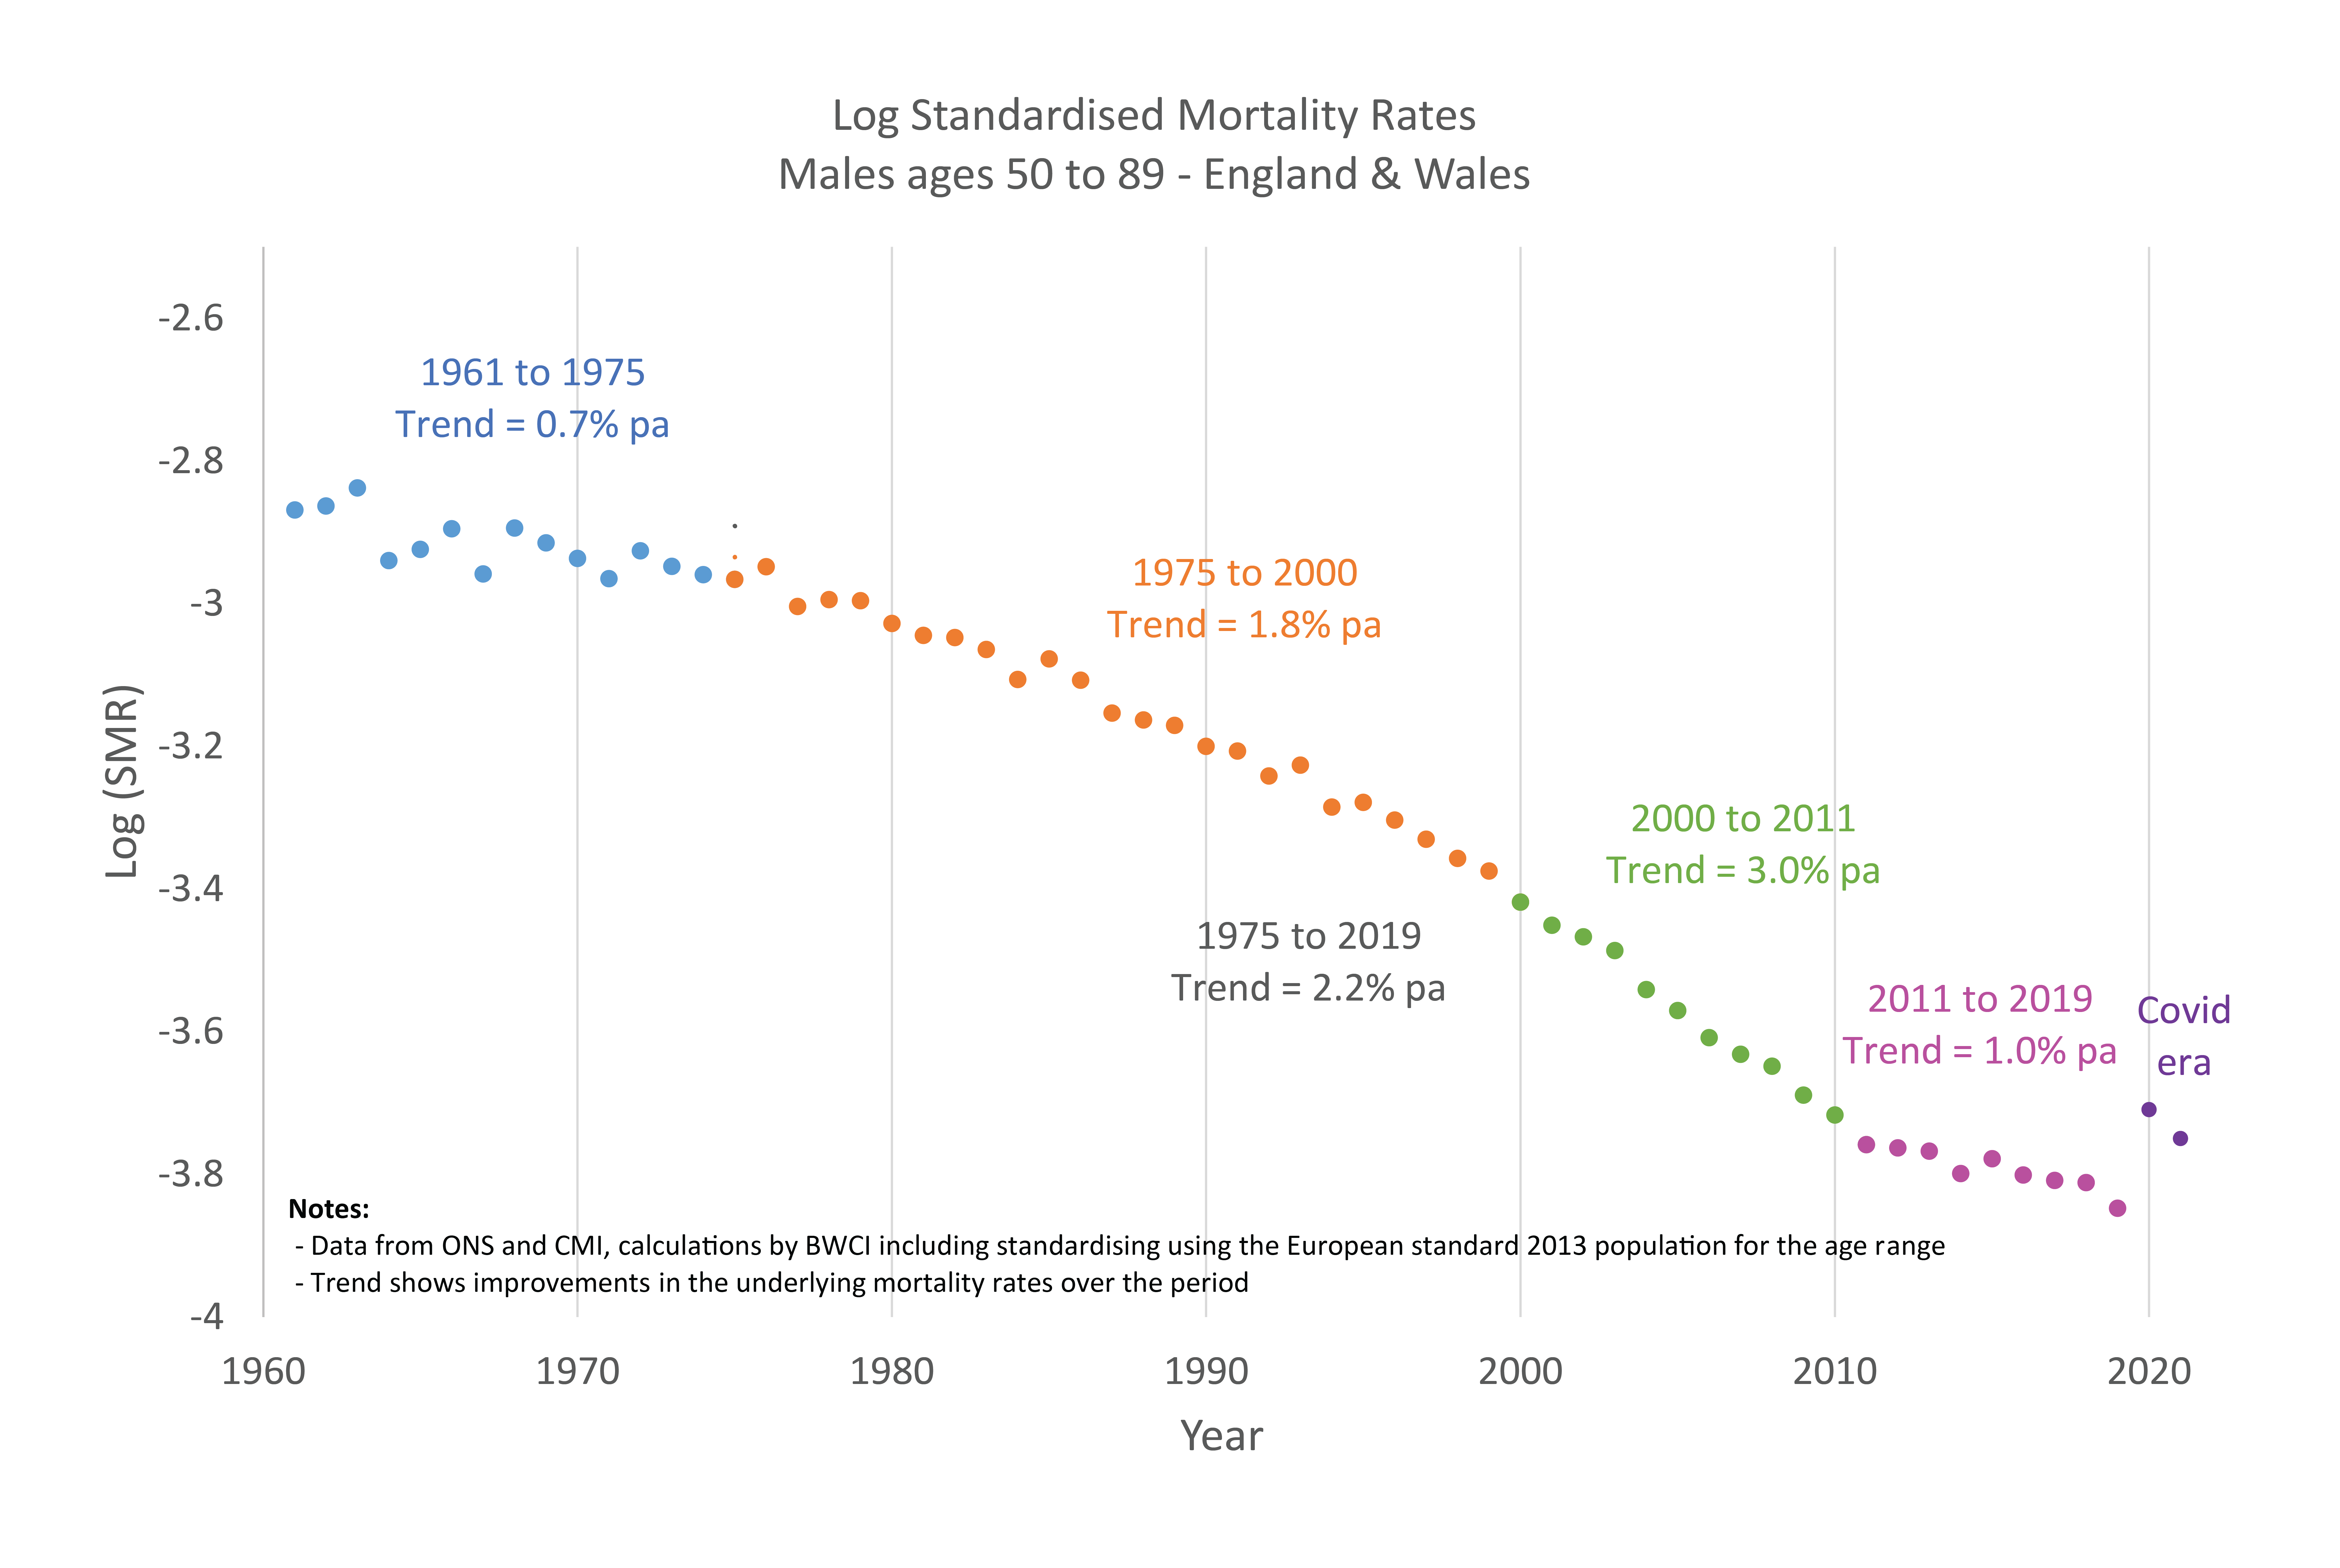
Progression of Mortality Rates since 1960
Base tables
The pension scheme base tables, known as the “S” series, are derived by the CMI from data collected from large public- and private-sector self-administered pension schemes¹, roughly every 5 years.
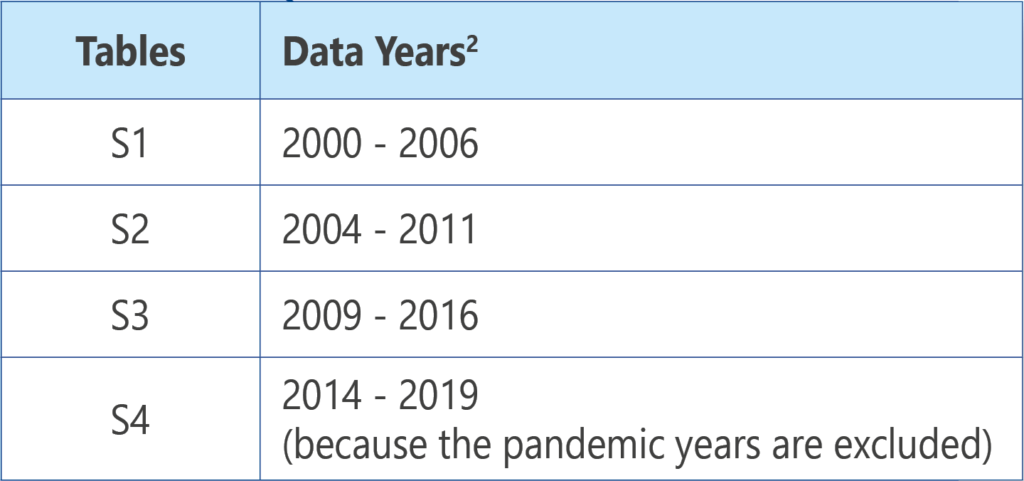
The most recent base tables, “S4”, were released on 26 February 2024. Each “S” series of tables consists of a suite of tables with mortality rates sub divided by:
- Gender
- Pension amount
- Retirement type: ill-health or normal health
- Pension scheme members or dependants of members
How do S4 tables compare to S3?
S4 tables generally show slightly higher mortality rates, and therefore slightly lower life expectancies, than the corresponding S3 tables. Consequently, pension schemes moving from S3 to S4 for their funding valuations, can expect to see their funding positions improve slightly as pensions are expected to be paid for a slightly shorter period.
New features in S4
There is a new sub-set of tables depending on pensioners’ locations according to their Index of Multiple Deprivation (IMD).
Improvement factors
The CMI, which releases updated “improvement” factors annually, allows for the most recent population data in the projection of future mortality trends. The latest factors, CMI_2022, were based on data from 1982 up to the end of 2022 and were published in 2023. CMI_2023 is due to be released in April 2024.
Deciding how to deal with the data in the COVID-19 pandemic years is problematic; mortality rates during 2020 and 2021 were much higher than they had been in the late 2010s. Future “improvements” would have been distorted if it had been assumed that the 2020 experience at the height of the pandemic would be indicative of future trends and that mortality would continue to worsen following the pandemic. The CMI’s solution was to disregard the 2020 and 2021 data entirely. A decision on what weight to put on data from subsequent years is made annually.
Mortality in 2023 has been much closer to the average from 2015-2019³. Even so, high weights on the 2022 and 2023 data reduces the projected future life expectancies, because the anticipated improvements in 2020 and 2021 did not occur, or at least were masked by the impact of the pandemic.
There are a range of views on whether the post-pandemic mortality represents a new baseline. Can the following current issues be expected to have some ongoing impact on future mortality experience?
- Strain on health services
- The effects of long COVID
- Changes in the influenza season
Following the release of CMI_2022 the intention is to gradually return to 100% weighting for years following the pandemic. The Mortality Projections Committee are consulting on weights of 10% for 2022 and 2023 in their proposal for CMI_2023. Counterintuitively, the 10% weights lead to life expectancies about halfway between giving no weight and full weight on the post-pandemic years. The CMI’s view is that using a weight of 50% or more would lead to too large a fall in life expectancies (by about three months for 65-year-old men⁴) compared to CMI_2022.
¹ Excludes schemes run by insurance company and State pensions
² CMI Working Paper 185: “Final S4 Series mortality tables” (2024)
³ CMI Working Paper 183: “CMI_2023 consultation” (2024)
⁴ CMI Working Paper 183: “CMI_2023 consultation” (2024)